この章しょう で学まな ぶこと
第だい 7 章しょう では、 プレゼン (第だい 6 章しょう ) や説せつ 明めい 文 (第だい 2 章しょう ) で必かなら ず出で てくる 図表説明ずひょうせつめい 集しゅう 中ちゅう 的に学まな びます。 IELTS や TOEFL の Writing Task 1、 大だい 学がく 入にゅう 試し の英えい 作文さくぶん 、 ビジネスのレポートで頻ひん 出しゅつ する重じゅう 要よう 分ぶん 野や です。
英語えいご で図表ずひょう を説せつ 明めい する時とき の 「型がた 」 は決き まっている ため、 表ひょう 現げん を暗あん 記き すれば必かなら ず書か けるようになります。
5 種しゅ 類るい の図表ずひょう (line / bar / pie / table / pictograph) の用よう 途と を知し る
増ぞう 加か ・減げん 少しょう ・横よこ ばい表あらわ す動どう 詞し と副ふく 詞し を使つか い分わ ける比ひ 較かく 構こう 文ぶん を使つか えるIELTS 型かた の 150 語かたり 図表ずひょう 描びょう 写しゃ のテンプレートを暗あん 記き する
ポイント: 図表ずひょう 説せつ 明めい では 「主しゅ 観かん 禁きん 止し 」 。 「I think this graph is interesting」 は NG。 「The graph shows ...」 と客きゃっ 観かん 的てき に。
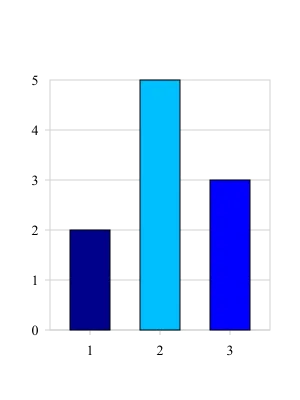
棒グラフぼうグラフ 項こう 目もく ごとの大きさおおきさ 比ひ 較かく 」 に適てき す。 図表ずひょう 説明せつめい では The bar chart shows ... / X is the highest, followed by Y のように、 概がい 要よう → 最大さいだい 最さい 小しょう → 特とく 徴ちょう → 結けつ 論ろん 段だん 階かい で述の べる。
1. 図表ずひょう の種しゅ 類るい と用よう 途と
種しゅ 類るい 英語えいご 用よう 途と 折お れ線せん グラフline graph 時とき 系けい 列れつ の変へん 化か 棒ぼう グラフbar chart / bar graph 項こう 目もく 間ま 比ひ 較かく 円えん グラフpie chart 割わり 合あい (合ごう 計けい 100 %)表ひょう table 数すう 値ち の一いち 覧らん 絵え グラフpictograph 視し 覚かく 的な数かず 比ひ 較かく
紹しょう 介かい 表ひょう 現げん (1 文目あやめ の王おう 道どう )英文えいぶん 訳やく The line graph shows the change in Japan 's population from 1950 to 2020. この折お れ線せん グラフは 1950 年ねん から 2020 年ねん の日本にほん の人じん 口こう の変へん 化か を示しめ しています。 The bar chart compares the average income of five countries. この棒ぼう グラフは 5 か国こく の平均へいきん 収しゅう 入にゅう を比ひ 較かく しています。 The pie chart illustrates the breakdown of household expenses. この円えん グラフは家か 計けい 支し 出しゅつ の内うち 訳わけ を示しめ しています。 The table presents the top 10 countries by GDP. この表ひょう は GDP 上じょう 位い 10 か国こく を表あらわ しています。
2. 増ぞう 加か ・減げん 少しょう の動どう 詞し と名めい 詞し
動どう 詞し (verb)種しゅ 類るい 表ひょう 現げん 訳やく 増ぞう 加か increase , rise, grow, go up, climb, jump, soar増ふ える、 上あ がる、 急きゅう 騰とう する減げん 少しょう decrease , fall, drop, decline, go down, plunge, plummet減へ る、 下さ がる、 急きゅう 落らく する横よこ ばいremain stable, stay the same, level off , plateau 横よこ ばい、 安あん 定てい 変へん 動どう fluctuate , vary変へん 動どう するピーク peak at / reach a peakピークに達たっ する 底そこ bottom out / hit a low 底そこ をつく
名めい 詞し (noun)動どう 詞し 名めい 詞し (a/an + ___)例れい increase an increase There was an increase of 5 %. decrease a decrease There was a decrease of 10 %. rise a rise a sharp rise in prices fall a fall a slight fall in temperature
例文れいぶん (動どう 詞し と名めい 詞し の両りょう 方ほう )英文えいぶん 訳やく The population increased from 80 million to 120 million. 人じん 口こう は 8000 万まん から 1 億おく 2000 万まん に増ぞう 加か しました。There was an increase of 40 million in the population. 人じん 口こう に 4000 万まん の増ぞう 加か がありました。Sales fell sharply in 2020 due to the pandemic. 売上うりあげ はパンデミックのせいで 2020 年ねん に急きゅう 落らく しました。 The unemployment rate remained stable at around 3 %. 失しつ 業ぎょう 率は約やく 3 % で横よこ ばいでした。
3. 変へん 化か の程てい 度ど を表あらわ す副ふく 詞し ・形容詞けいようし
程てい 度ど 副ふく 詞し (verb と)形容詞けいようし (noun と)急きゅう 激げき sharply, dramatically, rapidly, steeply sharp, dramatic, rapid, steep 大おお きくsignificantly, considerably, substantially significant, considerable, substantial ゆるやかに gradually, steadily, slightly gradual, steady, slight 急きゅう 速そく にquickly, swiftly quick, swift わずか slightly, marginally slight, marginal
副ふく 詞し + 動どう 詞し / 形容詞けいようし + 名めい 詞し のパターン英文えいぶん (verb)英文えいぶん (noun)訳やく Prices increased sharply . There was a sharp increase in prices. 価か 格かく が急きゅう 騰とう した。Sales declined gradually . There was a gradual decline in sales. 売上うりあげ が徐々じょ に下さ がった。 The number rose slightly . There was a slight rise in the number. 数すう がわずかに上あ がった。
大事だいじ :副ふく 詞し 」 と 「形容詞けいようし + noun」 は 同おな じ意味いみ を違ちが う形かたち で表あらわ す英えい 作文さくぶん で表ひょう 現げん が重じゅう 複ふく する時とき は、 一方いっぽう を他た 方ほう へ変か えると多た 彩さい になります。
4. 数すう 値ち と期き 間かん の表ひょう 現げん
数すう 値ち の表ひょう 現げん 英文えいぶん 訳やく It increased from 100 to 150. 100 から 150 に増ふ えた。 It rose by 50 (= 50 増ふ えた). 50 増ふ えた。 It doubled / tripled / quadrupled. 2 倍ばい / 3 倍ばい / 4 倍ばい になった。 It increased fivefold . 5 倍ばい に増ふ えた。 Sales reached a peak of 1 million. 売上うりあげ は 100 万まん のピークに達たっ した。 Sales hit a low of 100,000. 売上うりあげ は 10 万まん の底そこ をついた。
期き 間かん の表ひょう 現げん 英文えいぶん 訳やく Between 2000 and 2020, ...2000 年ねん から 2020 年ねん の間ま 、... Over the past decade , ...過か 去こ 10 年ねん で、...From 2010 onwards , ...2010 年ねん 以い 降こう 、... In 2020 alone , ...2020 年ねん だけで、...
5. 比ひ 較かく と順じゅん 位い
英文えいぶん 訳やく Japan has the highest literacy rate in Asia. 日本にほん はアジアで最高さいこう の識しき 字じ 率りつ を持も ちます。The number of users in 2020 was twice as large as in 2010. 2020 年ねん の利り 用よう 者しゃ 数すう は 2010 年ねん の 2 倍ばい でした。 Country A spent three times more than Country B. A 国くに は B 国くに より 3 倍ばい 多おお く支し 出しゅつ しました。 Japan ranked second , followed by South Korea. 日本にほん は 2 位い 、 次つ いで韓かん 国こく でした。Among the five countries, China had the largest share. 5 か国こく の中なか で、 中ちゅう 国ごく が最大さいだい のシェアを持も っていました。
6. 円えん グラフ (pie chart) 専せん 用よう 表ひょう 現げん
英文えいぶん 訳やく Housing accounts for 40 % of total expenses. 住じゅう 宅たく が総そう 支し 出しゅつ の 40 % を占し めます。Food makes up about a quarter. 食しょく 費ひ が約やく 4 分ぶん の 1 を占し めます。The largest portion goes to ___. 最大さいだい の割わり 合あい は ___ に当あ てられます。Other expenses comprise the remaining 10 %. その他た の支し 出しゅつ が残のこ り 10 % を構こう 成せい します。
7. 150 語かたり のテンプレート (IELTS 型かた )
[Introduction] (1 文)
The [graph type] shows / illustrates ___.
[Overview] (2 文)
Overall, ___. It is clear that ___.
[Body 1] (2 〜 3 文)
In ___, the figure was ___, and it ___ to ___ by ___.
[Body 2] (2 〜 3 文)
Meanwhile, ___ remained stable / fell / rose to ___.
[Conclusion]
(IELTS Task 1 で は Conclusion 不ふ 要よう )
完かん 成せい 例 (140 語かたり )
The line graph shows the change in Japan's population from 1950 to 2050 (estimated).
Overall, the population increased sharply from 1950, peaked around 2010, and is expected to decline rapidly afterward.
In 1950, Japan's population was about 80 million. It rose steadily over the next 60 years, reaching a peak of approximately 128 million around 2010. After this point, however, the figure began to fall gradually.
According to the estimate, the population is projected to drop to 100 million by 2050. This represents a decrease of about 22 % from the peak. The main reason is Japan's low birth rate and aging society.
英文えいぶん 訳やく The line graph shows the change in Japan's population from 1950 to 2050. この折お れ線せん グラフは 1950 〜 2050 年ねん の日本にほん の人じん 口こう 変へん 化か を示しめ します。 Overall, the population increased sharply from 1950, peaked around 2010, and is expected to decline rapidly. 全ぜん 体たい 的に、 人じん 口こう は 1950 年ねん から急きゅう 増ぞう し、 2010 年頃としごろ にピークを迎むか え、 その後ご 急きゅう 減げん する見込こ みです。The population is projected to drop to 100 million by 2050. 人じん 口こう は 2050 年ねん までに 1 億おく まで落お ち込こ む見通みとお しです。
8. よくあるミスと改かい 善ぜん
ミス 改かい 善ぜん "I think this graph is interesting" 等とう 主しゅ 観かん 表ひょう 現げん "The graph shows ..." に変か える 動どう 詞し がワンパターン (increase ばかり)rise, grow, climb, soar 等とう で変へん 化か 副ふく 詞し の位い 置ち ミス動どう 詞し の 後うし ろ置お く (rose sharply ○)Overview (全ぜん 体たい 像ぞう ) を書か かない 必かなら ず "Overall, ..." の 1 文ぶん を入い れる数すう 字じ を全すべ て書か こうとする重じゅう 要よう な数すう 字じ だけ選えら ぶ
9. まとめ
項こう 目もく ポイント 1 文目あやめ The [type] shows / illustrates / compares ___ 2 文目あやめ (Overview) Overall, ___ 動どう 詞し (増ぞう )increase, rise, grow, climb, soar, double 動どう 詞し (減げん )decrease, fall, drop, decline, plunge 副ふく 詞し sharply, gradually, slightly, dramatically 比ひ 較かく the highest, twice as large as
次じ 章しょう へ:第だい 8 章しょう では、 グループで議ぎ 論ろん する場ば で必ひっ 須す な ディスカッションでぃすかっしょん 技ぎ 術じゅつ を学まな びます。
まとめ — 図表説明ずひょうせつめい 行くだり で
1 文目あやめ は "The [type] shows / illustrates / compares ___" でグラフの種類しゅるい (棒グラフぼうグラフ 円グラフえんぐらふ 内容ないよう を提示ていじ 、 2 文目あやめ で "Overall, ___" と全体ぜんたい 像ぞう を述の べる。
増加ぞうか の動詞どうし は increase / rise / grow / climb / soar / double、 減少げんしょう は decrease / fall / drop / decline / plunge と多彩たさい に使つか い分わ け、 副詞ふくし は動詞どうし の後うし ろに置お く (rose sharply)。副詞ふくし は sharply / gradually / slightly / dramatically、 比較ひかく は "the highest" "twice as large as" を使つか い、 主観しゅかん 表現ひょうげん を避さ け重要じゅうよう な数字すうじ だけを選えら ぶ。